Fuzzy Variables
- class fuzzy_expert.variable.FuzzyVariable(universe_range, terms=None, step=0.1)[source]
Bases:
objectCreates a fuzzy variable.
- Parameters
unverse_range – Limits of the universe of discourse.
terms – Dictionary where each term is the key of the dictionary, and the values is the membership function.
step – Value controling the resolution for the discrete representation of the universe.
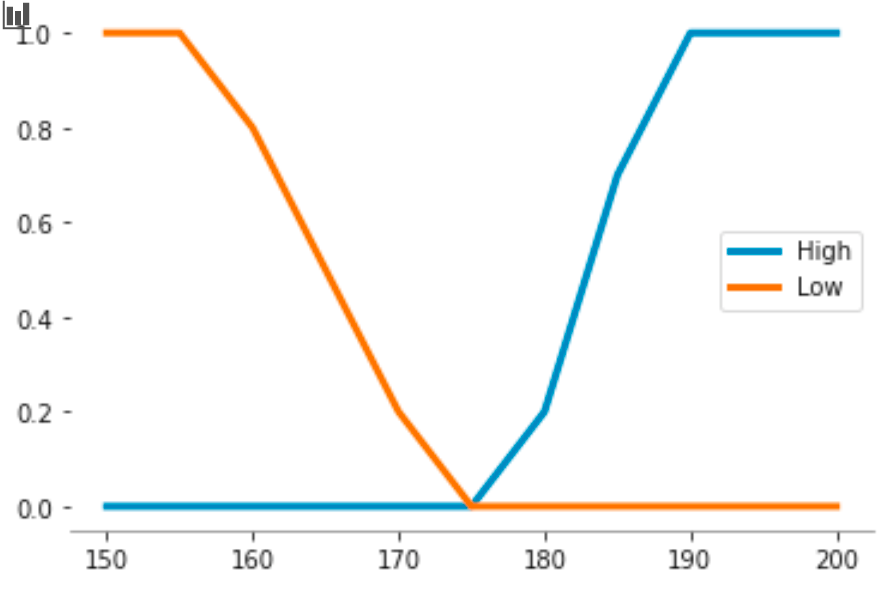
>>> from fuzzy_expert.variable import FuzzyVariable
>>> v = FuzzyVariable(
...     universe_range=(150, 200),
...     terms={
...         "High": [(175, 0), (180, 0.2), (185, 0.7), (190, 1)],
...         "Low": [(155, 1), (160, 0.8), (165, 0.5), (170, 0.2), (175, 0)],
...     },
... )
>>> v.plot()

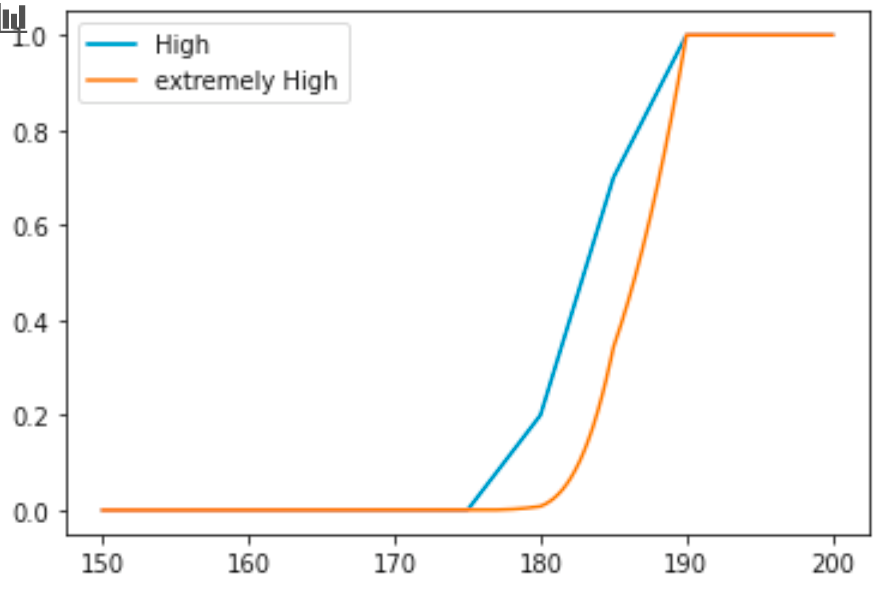
- get_modified_membeship(term, modifiers=None)[source]
Returns the membership modified values for the term.
- Parameters
term – Name of the fuzzy set.
modifiers – List of modifiers.
>>> import matplotlib.pyplot as plt
>>> from fuzzy_expert.variable import FuzzyVariable
>>> v = FuzzyVariable(
...     universe_range=(150, 200),
...     terms={
...         "High": [(175, 0), (180, 0.2), (185, 0.7), (190, 1)],
...         "Low": [(155, 1), (160, 0.8), (165, 0.5), (170, 0.2), (175, 0)],
...     },
... )
>>> y = v.get_modified_membeship('High' ,['extremely'])
>>> _ = plt.plot(v.universe, v['High'], label='High')
>>> _ = plt.plot(v.universe, y, label='extremely High')
>>> _ = plt.legend()
>>> plt.show()

- plot(fmt='-', linewidth=3)[source]
Plots a fuzzy variable.
- Parameters
fmt – Format string passed to Matplotlib.pyplot.
linewidth – Width of lines.
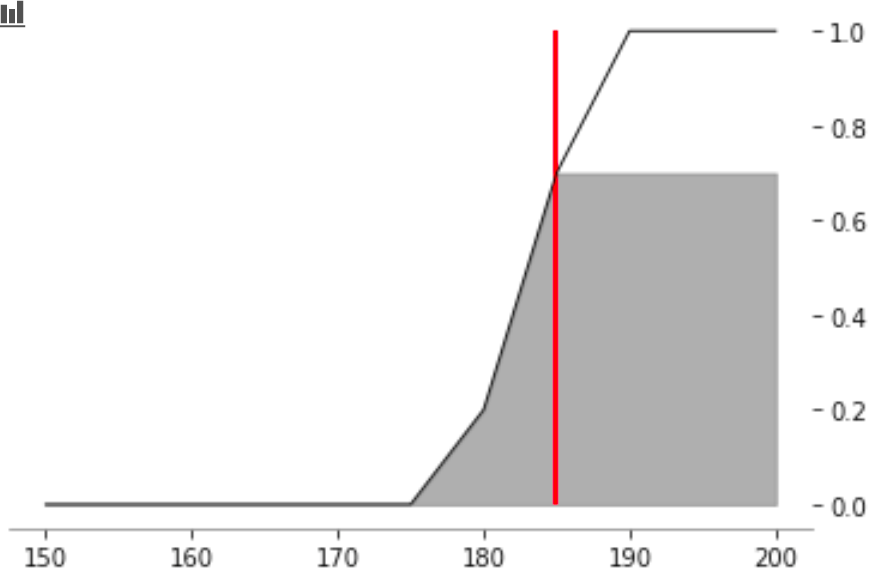
- plot_input(value, fuzzyset, view_xaxis=True, view_yaxis='left')[source]
Plots the fuzzy set, and the input.
- Parameters
value – Crisp or fuzzy input value.
fuzzyset – Term to plot.
view_xaxis – Draw the x-axis of plot
view_yaxis – Draw the y-axis of plot at left or right side.
>>> from fuzzy_expert.variable import FuzzyVariable
>>> v = FuzzyVariable(
...     universe_range=(150, 200),
...     terms={
...         "High": [(175, 0), (180, 0.2), (185, 0.7), (190, 1)],
...         "Low": [(155, 1), (160, 0.8), (165, 0.5), (170, 0.2), (175, 0)],
...     },
... )
>>> v.plot_input(value=185, fuzzyset='High', view_xaxis=True, view_yaxis='right')
