Insersión directa de gráficas en HTML usando Jinja2#
15 min | Última modificación: Marzo 31, 2020.
Data#
(Igual al tutorial anterior)
[1]:
import pandas as pd
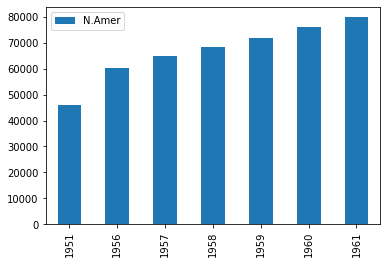
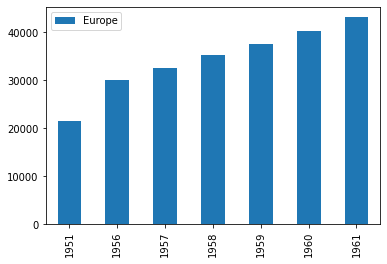
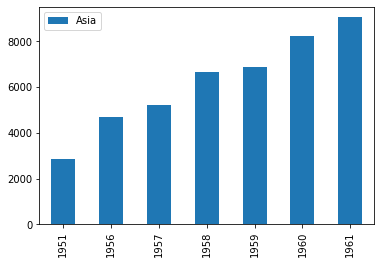
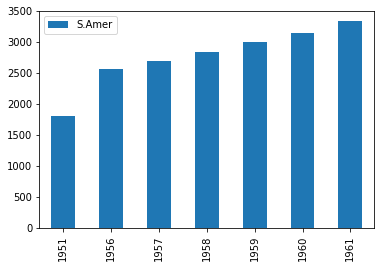
data = [
[45939, 21574, 2876, 1815, 1646, 89, 555],
[60423, 29990, 4708, 2568, 2366, 1411, 733],
[64721, 32510, 5230, 2695, 2526, 1546, 773],
[68484, 35218, 6662, 2845, 2691, 1663, 836],
[71799, 37598, 6856, 3000, 2868, 1769, 911],
[76036, 40341, 8220, 3145, 3054, 1905, 1008],
[79831, 43173, 9053, 3338, 3224, 2005, 1076],
]
data = pd.DataFrame(
data=data,
index=[1951, 1956, 1957, 1958, 1959, 1960, 1961],
columns=["N.Amer", "Europe", "Asia", "S.Amer", "Oceania", "Africa", "Mid.Amer"],
)
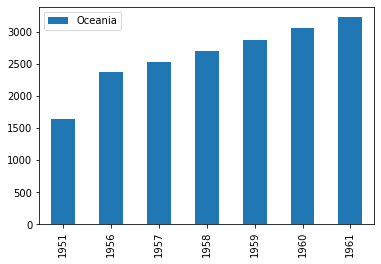
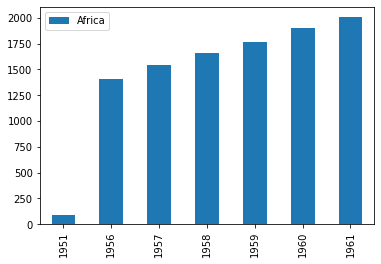
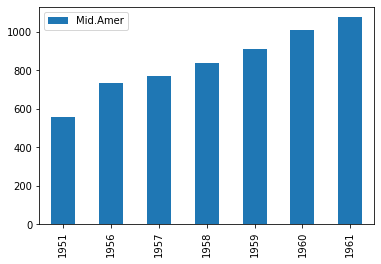
data
[1]:
| N.Amer | Europe | Asia | S.Amer | Oceania | Africa | Mid.Amer | |
|---|---|---|---|---|---|---|---|
| 1951 | 45939 | 21574 | 2876 | 1815 | 1646 | 89 | 555 |
| 1956 | 60423 | 29990 | 4708 | 2568 | 2366 | 1411 | 733 |
| 1957 | 64721 | 32510 | 5230 | 2695 | 2526 | 1546 | 773 |
| 1958 | 68484 | 35218 | 6662 | 2845 | 2691 | 1663 | 836 |
| 1959 | 71799 | 37598 | 6856 | 3000 | 2868 | 1769 | 911 |
| 1960 | 76036 | 40341 | 8220 | 3145 | 3054 | 1905 | 1008 |
| 1961 | 79831 | 43173 | 9053 | 3338 | 3224 | 2005 | 1076 |
Generación de las figuras#
[2]:
import io, base64
from flask import Markup

images = {}
for col in data.columns:
    img = io.BytesIO()
    data.plot.bar(y=col).get_figure().savefig(img, format='png');
    img.seek(0)
    image_decode = base64.b64encode(img.getvalue()).decode()
    images[col] = Markup('<img src="data:image/png;base64,{}">'.format(image_decode))
Plantilla para la página web#
[3]:
!mkdir -p templates
[4]:
%%writefile templates/index.html

<!DOCTYPE html>
<html lang="en">
  <head>
    <meta charset="utf-8">
    <title>Telephones</title>

    <style>

        body {
          font-family: Arial, Helvetica, sans-serif;
          padding-left: 10px;
        }

        header {
            font-size: 20px;
        }

        nav {
          float: left;
          width: 20%;
          height: 150px;
          background: #eeeeee;
          padding: 20px;
        }

        .seltext {
            font-weight: bold;
        }

        .auxtext {
            font-size: 14px;
            color: #807F7F;
        }

    </style>

  </head>
  <body>

    <header>
      <h2>Telephones by region</h2>
    </header>

    <nav style="border:1px solid #BEBDBD; border-width:2px;">
      <p class="seltext">Region:</p>
      <select id="region" name="region"  onchange="selectPlot()">

        {% for region in region_names %}
            <option value="{{ region }}">{{ region }}</option>
        {% endfor %}

      </select>
      <br>
      <hr>
      <p class="auxtext"> Data from AT&T (1961) The World's Telephones. </p>
    </nav>

    <div>

      {% for region_name in region_names %}
        {% if region_name == region_names[0] %}
          <div class="myImage" id="{{ region_name }}" style="display:block"> {{ images[region_name] }} </div>
        {% else %}
          <div class="myImage" id="{{ region_name }}" style="display:none">  {{ images[region_name] }} </div>
        {% endif %}
      {% endfor %}

    </div>

    <script>
      function selectPlot() {
        var region = document.getElementById("region").value;
        var images = document.getElementsByClassName("myImage");
        for (var i = 0; i < images.length; i++) {
          if (images[i].id == region) {
            images[i].style.display = "block"
          }else{
            images[i].style.display = "none"
          }
        }
      }
    </script>
  </body>
</html>
Overwriting templates/index.html
Generación de la página#
[5]:
from jinja2 import Template

str = open("templates/index.html", "r").read()
template = Template(str)
str = template.render(region_names=data.columns, images=images)
open("index.html", "w").write(str);