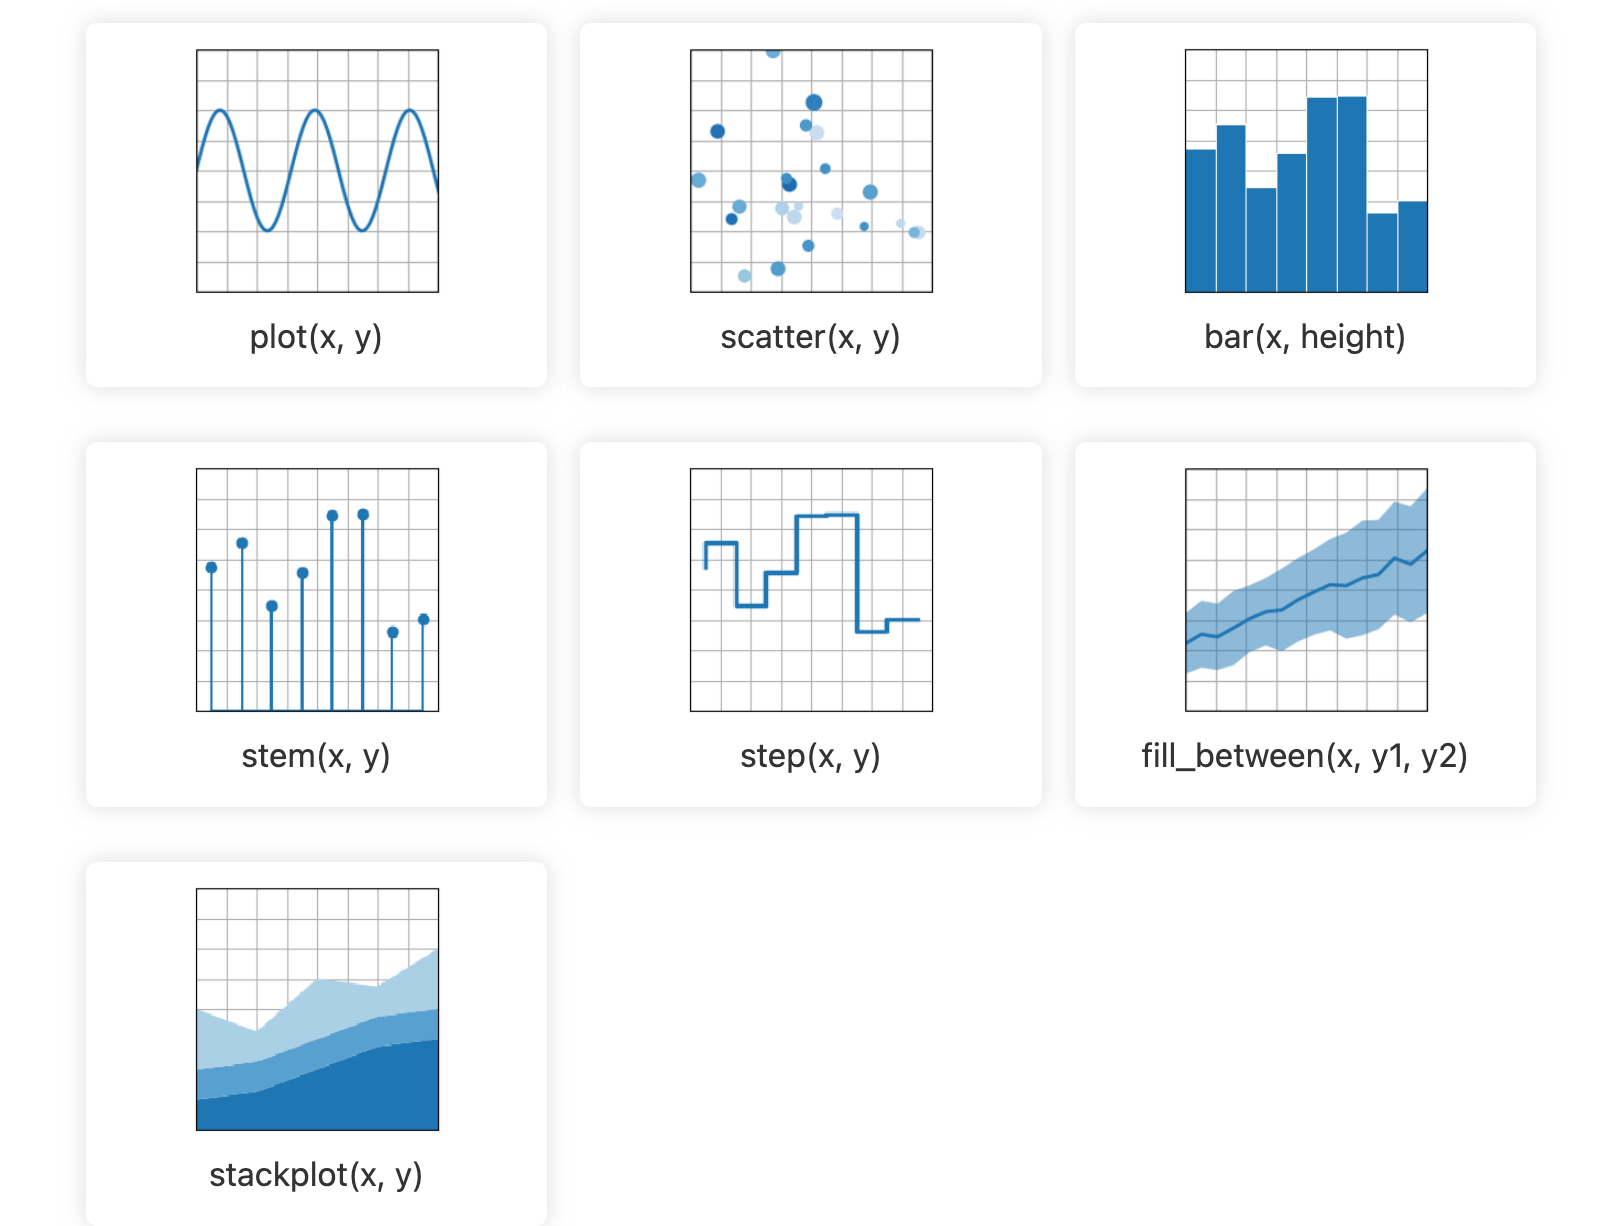
Gráficos básicos#
Ultima modificación: Feb 04, 2024 | YouTube
[1]:
import matplotlib.pyplot as plt
import numpy as np
[2]:
#
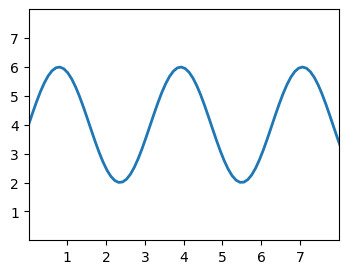
# plot(x, y)
#
x = np.linspace(0, 10, 100)
y = 4 + 2 * np.sin(2 * x)

fig, ax = plt.subplots(figsize=(4, 3))
ax.plot(x, y, linewidth=2.0)
ax.set(xlim=(0, 8), xticks=np.arange(1, 8), ylim=(0, 8), yticks=np.arange(1, 8))
plt.show()
[3]:
#
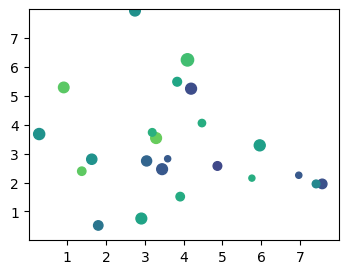
# scatter(x, y)
#
np.random.seed(3)
x = 4 + np.random.normal(0, 2, 24)
y = 4 + np.random.normal(0, 2, len(x))
sizes = np.random.uniform(15, 80, len(x))
colors = np.random.uniform(15, 80, len(x))

fig, ax = plt.subplots(figsize=(4, 3))
ax.scatter(x, y, s=sizes, c=colors, vmin=0, vmax=100)
ax.set(xlim=(0, 8), xticks=np.arange(1, 8), ylim=(0, 8), yticks=np.arange(1, 8))
plt.show()
[4]:
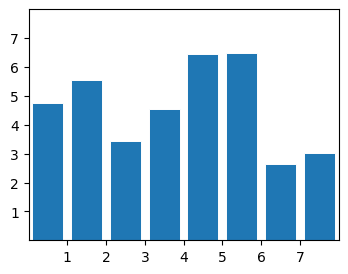
#
# bar(x, height)
#
np.random.seed(3)
x = 0.5 + np.arange(8)
height = np.random.uniform(2, 7, len(x))

fig, ax = plt.subplots(figsize=(4, 3))
ax.bar(x, height, width=0.8, edgecolor="white", linewidth=0.7)
ax.set(xlim=(0, 8), xticks=np.arange(1, 8), ylim=(0, 8), yticks=np.arange(1, 8))
plt.show()
[5]:
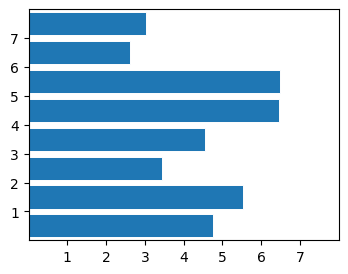
#
# barh(y, widht)
#
np.random.seed(3)
y = 0.5 + np.arange(8)
width = np.random.uniform(2, 7, len(x))

fig, ax = plt.subplots(figsize=(4, 3))
ax.barh(y, width, height=0.8, edgecolor="white", linewidth=0.7)
ax.set(xlim=(0, 8), xticks=np.arange(1, 8), ylim=(0, 8), yticks=np.arange(1, 8))
plt.show()
[6]:
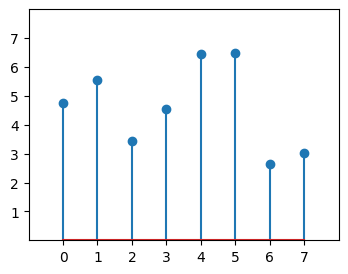
#
# stem(x, y)
#
np.random.seed(3)
x = np.arange(8)
y = np.random.uniform(2, 7, len(x))

fig, ax = plt.subplots(figsize=(4, 3))
ax.stem(x, y)
ax.set(xlim=(-1, 8), xticks=np.arange(0, 8), ylim=(0, 8), yticks=np.arange(1, 8))
plt.show()
[7]:
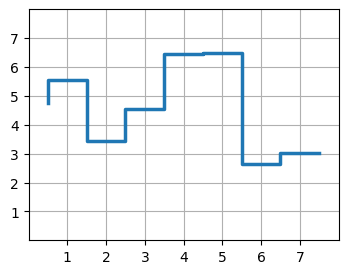
#
# step(x, y)
#
np.random.seed(3)
x = 0.5 + np.arange(8)
y = np.random.uniform(2, 7, len(x))

fig, ax = plt.subplots(figsize=(4, 3))
ax.step(x, y, linewidth=2.5)
ax.set(xlim=(0, 8), xticks=np.arange(1, 8), ylim=(0, 8), yticks=np.arange(1, 8))
plt.grid()
plt.show()
[8]:
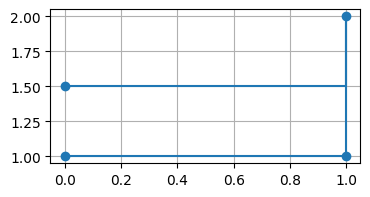
x = [0, 1, 1, 0]
y = [1, 1, 2, 1.5]

fig, ax = plt.subplots(figsize=(4, 2))
ax.step(x, y, marker="o")
plt.grid()
plt.show()
[9]:
#
# fill_between(x, y1, y2)
#
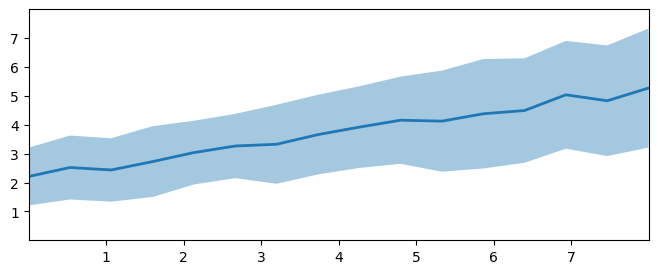
np.random.seed(1)
x = np.linspace(0, 8, 16)
y1 = 3 + 4 * x / 8 + np.random.uniform(0.0, 0.5, len(x))
y2 = 1 + 2 * x / 8 + np.random.uniform(0.0, 0.5, len(x))

fig, ax = plt.subplots(figsize=(8, 3))
ax.fill_between(x, y1, y2, alpha=0.4, linewidth=0)
ax.plot(x, (y1 + y2) / 2, linewidth=2)
ax.set(xlim=(0, 8), xticks=np.arange(1, 8), ylim=(0, 8), yticks=np.arange(1, 8))
plt.show()
[10]:
#
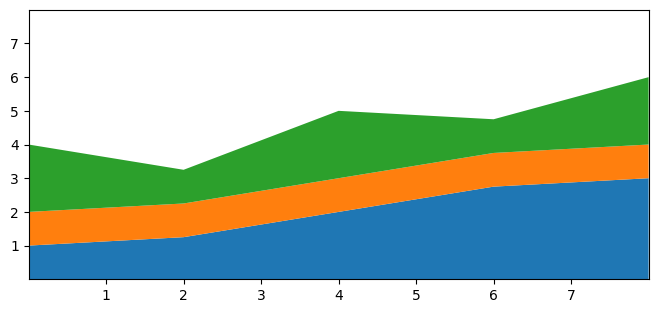
# stackplot(x, y)
#
x = np.arange(0, 10, 2)
ay = [1, 1.25, 2, 2.75, 3]
by = [1, 1, 1, 1, 1]
cy = [2, 1, 2, 1, 2]
y = np.vstack([ay, by, cy])
y
[10]:
array([[1.  , 1.25, 2.  , 2.75, 3.  ],
       [1.  , 1.  , 1.  , 1.  , 1.  ],
       [2.  , 1.  , 2.  , 1.  , 2.  ]])
[11]:
fig, ax = plt.subplots(figsize=(8, 3.5))
ax.stackplot(x, y)
ax.set(xlim=(0, 8), xticks=np.arange(1, 8), ylim=(0, 8), yticks=np.arange(1, 8))
plt.show()
