Caso de estudio: Visualización precios de bolsa#
Ultima modificación: Feb 04, 2024 | YouTube
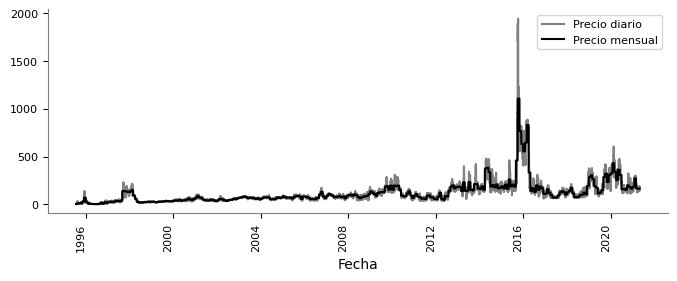
La url ‘https://raw.githubusercontent.com/jdvelasq/datalabs/master/datasets/precio_bolsa_nacional/csv/*.csv’ contiene los archivos de los precios horarios de bolsa para el mercado electrico colombiano. Construya una gráfica que contenga los precios promedios diarios y los precios promedios mensuales.

[1]:
#
# Creación del vector de fechas
#
fechas = [
    "{:4d}{:02d}".format(year, month)
    for year in range(1995, 2022)
    for month in range(1, 13)
]
fechas = [fecha for fecha in fechas if fecha >= "199507" and fecha <= "202104"]
fechas[0], fechas[-1], len(fechas)
[1]:
('199507', '202104', 310)
[2]:
#
# Lectura de los archivos
#
import pandas as pd

url = (
    "https://raw.githubusercontent.com/"
    "jdvelasq/datalabs/master/datasets/precio_bolsa_nacional/csv/{}.csv"
)

org_df = pd.concat([pd.read_csv(url.format(fecha)) for fecha in fechas])
org_df.head()
[2]:
| Fecha | 0 | 1 | 2 | 3 | 4 | 5 | 6 | 7 | 8 | ... | 14 | 15 | 16 | 17 | 18 | 19 | 20 | 21 | 22 | 23 | |
|---|---|---|---|---|---|---|---|---|---|---|---|---|---|---|---|---|---|---|---|---|---|
| 0 | 1995-07-21 | 1.073 | 1.0 | 1.0 | 1.0 | 1.0 | 1.0 | 5.0 | 6.0 | 6.0 | ... | 5.0 | 1.0 | 1.0 | 5.0 | 12.0 | 16.67 | 11.929 | 5.0 | 1.0 | 1.0 |
| 1 | 1995-07-22 | 1.073 | 1.073 | 1.0 | 1.0 | 1.0 | 1.073 | 1.303 | 1.303 | 1.303 | ... | 1.073 | 1.0 | 1.0 | 1.0 | 1.303 | 2.5 | 2.5 | 1.303 | 1.073 | 1.073 |
| 2 | 1995-07-23 | 1.073 | 1.0 | 1.0 | 1.0 | 1.0 | 1.0 | 0.1 | 1.0 | 1.0 | ... | 1.0 | 0.1 | 0.1 | 1.0 | 1.238 | 1.238 | 1.238 | 1.238 | 1.073 | 1.0 |
| 3 | 1995-07-24 | 1.0 | 1.0 | 0.99 | 1.0 | 1.0 | 1.073 | 3.0 | 3.0 | 3.0 | ... | 1.073 | 1.073 | 3.0 | 2.0 | 18.63 | 22.5 | 9.256 | 3.0 | 1.073 | 1.0 |
| 4 | 1995-07-25 | 0.99 | 0.99 | 0.989 | 0.99 | 0.99 | 1.073 | 1.263 | 1.263 | 1.263 | ... | 1.073 | 1.073 | 1.073 | 1.073 | 1.263 | 1.5 | 1.263 | 1.263 | 1.073 | 0.99 |
5 rows × 25 columns
[3]:
org_df.tail()
[3]:
| Fecha | 0 | 1 | 2 | 3 | 4 | 5 | 6 | 7 | 8 | ... | 14 | 15 | 16 | 17 | 18 | 19 | 20 | 21 | 22 | 23 | |
|---|---|---|---|---|---|---|---|---|---|---|---|---|---|---|---|---|---|---|---|---|---|
| 25 | 2021-04-26 | 145.89 | 163.89 | 162.74 | 145.89 | 163.89 | 166.5 | 170.89 | 189.89 | 189.89 | ... | 218.89 | 218.89 | 201.89 | 189.89 | 201.89 | 201.89 | 201.89 | 189.89 | 189.89 | 173.89 |
| 26 | 2021-04-27 | 170.02 | 170.52 | 170.02 | 170.02 | 170.02 | 170.52 | 172.52 | 173.52 | 188.52 | ... | 189.52 | 189.52 | 189.52 | 188.52 | 189.52 | 189.52 | 189.52 | 187.52 | 173.52 | 172.52 |
| 27 | 2021-04-28 | 147.25 | 147.25 | 147.25 | 147.25 | 147.25 | 159.23 | 169.25 | 190.25 | 190.25 | ... | 190.25 | 190.25 | 190.25 | 176.25 | 190.25 | 190.25 | 190.25 | 190.25 | 169.25 | 147.25 |
| 28 | 2021-04-29 | 116.12 | 129.12 | 129.12 | 129.12 | 129.12 | 129.12 | 129.12 | 168.12 | 168.12 | ... | 186.12 | 204.12 | 168.12 | 168.12 | 204.12 | 204.12 | 186.12 | 168.12 | 168.12 | 168.12 |
| 29 | 2021-04-30 | 113.42 | 113.42 | 113.42 | 113.42 | 113.42 | 125.42 | 125.42 | 125.42 | 160.32 | ... | 160.32 | 160.32 | 157.4 | 157.4 | 160.32 | 160.32 | 160.32 | 160.32 | 160.32 | 125.42 |
5 rows × 25 columns
[4]:
#
# Manipulacion del dataframe
#
melted_df = pd.melt(
    org_df,
    id_vars="Fecha",
    var_name="Hora",
    value_name="Precio",
)

melted_df = melted_df.sort_values(["Fecha", "Hora"]).reset_index(drop=True)
melted_df.head()
[4]:
| Fecha | Hora | Precio | |
|---|---|---|---|
| 0 | 1995-07-21 | 0 | 1.073 |
| 1 | 1995-07-21 | 1 | 1.0 |
| 2 | 1995-07-21 | 10 | 6.0 |
| 3 | 1995-07-21 | 11 | 9.256 |
| 4 | 1995-07-21 | 12 | 9.256 |
[5]:
#
# Verificación de los tipos para buscar problemas
#
melted_df.dtypes
[5]:
Fecha     object
Hora      object
Precio    object
dtype: object
[6]:
#
# Registros con precios NA
#
melted_df.Precio.isna().sum()
[6]:
21
[7]:
#
# Tamaño original del dataframe
#
melted_df.shape
[7]:
(228528, 3)
[8]:
#
#
# Eliminación de NA y tamaño final del dataframe
#
melted_df = melted_df.dropna()
melted_df.shape
[8]:
(228507, 3)
[9]:
melted_df
[9]:
| Fecha | Hora | Precio | |
|---|---|---|---|
| 0 | 1995-07-21 | 0 | 1.073 |
| 1 | 1995-07-21 | 1 | 1.0 |
| 2 | 1995-07-21 | 10 | 6.0 |
| 3 | 1995-07-21 | 11 | 9.256 |
| 4 | 1995-07-21 | 12 | 9.256 |
| ... | ... | ... | ... |
| 228523 | 2021-04-30 | 5 | 125.42 |
| 228524 | 2021-04-30 | 6 | 125.42 |
| 228525 | 2021-04-30 | 7 | 125.42 |
| 228526 | 2021-04-30 | 8 | 160.32 |
| 228527 | 2021-04-30 | 9 | 160.32 |
228507 rows × 3 columns
[10]:
#
# Búsqueda de registros con str en los precios
#
melted_df[melted_df["Precio"].map(lambda x: isinstance(x, str))].sort_values("Precio")
[10]:
| Fecha | Hora | Precio | |
|---|---|---|---|
| 179327 | 2015-09-25 | 9 | 1.004,81 |
| 179314 | 2015-09-25 | 18 | 1.004,81 |
| 179358 | 2015-09-27 | 14 | 1.014,81 |
| 179354 | 2015-09-27 | 10 | 1.014,81 |
| 179362 | 2015-09-27 | 18 | 1.014,81 |
| ... | ... | ... | ... |
| 179804 | 2015-10-15 | 6 | 990,52 |
| 179805 | 2015-10-15 | 7 | 990,52 |
| 179753 | 2015-10-13 | 3 | 990,52 |
| 179754 | 2015-10-13 | 4 | 990,52 |
| 179800 | 2015-10-15 | 23 | 990,52 |
8760 rows × 3 columns
[11]:
#
# Se elimina el '.' de los miles
#
melted_df["Precio"] = melted_df["Precio"].map(
    lambda x: x.replace(".", "") if isinstance(x, str) else x
)

#
# Se reemplaza la ',' por '.'
#
melted_df["Precio"] = melted_df["Precio"].map(
    lambda x: float(x.replace(",", ".")) if isinstance(x, str) else x
)

#
# Vefificación
#
melted_df["Precio"][melted_df["Precio"].map(lambda x: isinstance(x, str))].sort_values()
[11]:
Series([], Name: Precio, dtype: float64)
[12]:
#
# Revisión de los tipos de datos
#
melted_df.dtypes
[12]:
Fecha      object
Hora       object
Precio    float64
dtype: object
[13]:
#
# Cálculo de los precios diarios y renombramiento de la columna
#
import numpy as np

precios_df = melted_df.groupby(["Fecha"]).agg({"Precio": np.mean})
precios_df = precios_df.rename(columns={"Precio": "Precio diario"})
precios_df.head()
[13]:
| Precio diario | |
|---|---|
| Fecha | |
| 1995-07-21 | 4.924333 |
| 1995-07-22 | 1.269500 |
| 1995-07-23 | 0.953083 |
| 1995-07-24 | 4.305917 |
| 1995-07-25 | 1.149167 |
[14]:
#
# Tranformación del indice a tipo fecha
#
precios_df.index = pd.to_datetime(precios_df.index)

#
# Cálculo del precio promedio por mes
#
precios_df["Precio mensual"] = precios_df.groupby(
    [precios_df.index.year, precios_df.index.month]
)["Precio diario"].transform(np.mean)

precios_df.head()
[14]:
| Precio diario | Precio mensual | |
|---|---|---|
| Fecha | ||
| 1995-07-21 | 4.924333 | 1.552087 |
| 1995-07-22 | 1.269500 | 1.552087 |
| 1995-07-23 | 0.953083 | 1.552087 |
| 1995-07-24 | 4.305917 | 1.552087 |
| 1995-07-25 | 1.149167 | 1.552087 |
[15]:
import matplotlib.pyplot as plt

precios_df.plot(style=["gray", "k"], figsize=(8, 3))
plt.xticks(rotation="vertical", fontsize=8)
plt.yticks(fontsize=8)
plt.gca().spines["left"].set_color("gray")
plt.gca().spines["bottom"].set_color("gray")
plt.gca().spines["top"].set_visible(False)
plt.gca().spines["right"].set_visible(False)
plt.legend(fontsize=8)
plt.show()
