Gráficos estadísticos#
Ultima modificación: Feb 04, 2024 | YouTube
[1]:
import matplotlib.pyplot as plt
import numpy as np
[2]:
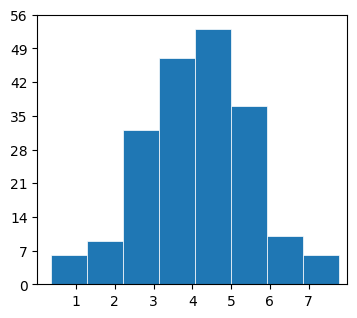
#
# hist(x)
#
np.random.seed(1)
x = 4 + np.random.normal(0, 1.5, 200)

fig, ax = plt.subplots(figsize=(4, 3.5))
ax.hist(x, bins=8, linewidth=0.5, edgecolor="white")
ax.set(xlim=(0, 8), xticks=np.arange(1, 8), ylim=(0, 56), yticks=np.linspace(0, 56, 9))
plt.show()
[3]:
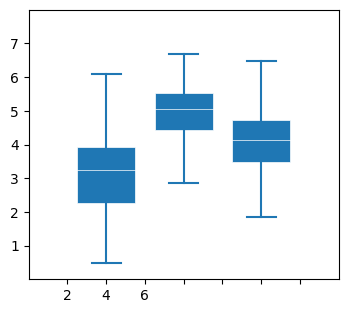
#
# boxplot(X)
#
np.random.seed(10)
D = np.random.normal((3, 5, 4), (1.25, 1.00, 1.25), (100, 3))

fig, ax = plt.subplots(figsize=(4, 3.5))
VP = ax.boxplot(
    D,
    positions=[2, 4, 6],
    widths=1.5,
    patch_artist=True,
    showmeans=False,
    showfliers=False,
    medianprops={"color": "white", "linewidth": 0.5},
    boxprops={"facecolor": "C0", "edgecolor": "white", "linewidth": 0.5},
    whiskerprops={"color": "C0", "linewidth": 1.5},
    capprops={"color": "C0", "linewidth": 1.5},
)

ax.set(xlim=(0, 8), xticks=np.arange(1, 8), ylim=(0, 8), yticks=np.arange(1, 8))

plt.show()
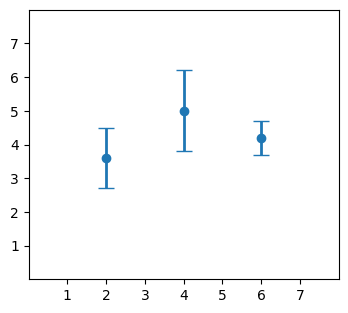
[4]:
#
# errorbar(x, y, yerr, xerr)
#
np.random.seed(1)
x = [2, 4, 6]
y = [3.6, 5, 4.2]
yerr = [0.9, 1.2, 0.5]

fig, ax = plt.subplots(figsize=(4, 3.5))
ax.errorbar(x, y, yerr, fmt="o", linewidth=2, capsize=6)
ax.set(xlim=(0, 8), xticks=np.arange(1, 8), ylim=(0, 8), yticks=np.arange(1, 8))
plt.show()
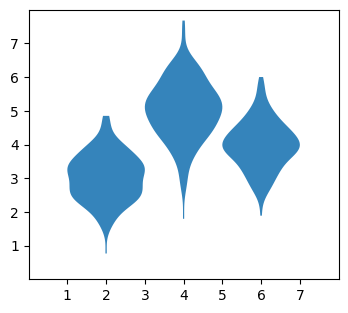
[5]:
#
# violinplot(D)
#
np.random.seed(10)
D = np.random.normal((3, 5, 4), (0.75, 1.00, 0.75), (200, 3))

fig, ax = plt.subplots(figsize=(4, 3.5))
vp = ax.violinplot(
    D, [2, 4, 6], widths=2, showmeans=False, showmedians=False, showextrema=False
)
for body in vp["bodies"]:
    body.set_alpha(0.9)

ax.set(xlim=(0, 8), xticks=np.arange(1, 8), ylim=(0, 8), yticks=np.arange(1, 8))
plt.show()
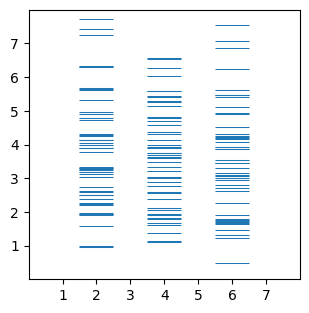
[6]:
#
# eventplot(D)
#
np.random.seed(1)
x = [2, 4, 6]
D = np.random.gamma(4, size=(3, 50))

fig, ax = plt.subplots(figsize=(3.5, 3.5))
ax.eventplot(D, orientation="vertical", lineoffsets=x, linewidth=0.75)
ax.set(xlim=(0, 8), xticks=np.arange(1, 8), ylim=(0, 8), yticks=np.arange(1, 8))
plt.show()
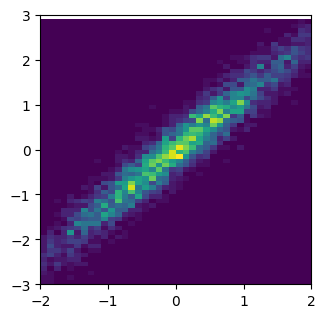
[7]:
#
# hist2d(x, y)
#
np.random.seed(1)
x = np.random.randn(5000)
y = 1.2 * x + np.random.randn(5000) / 3

fig, ax = plt.subplots(figsize=(3.5, 3.5))
ax.hist2d(x, y, bins=(np.arange(-3, 3, 0.1), np.arange(-3, 3, 0.1)))
ax.set(xlim=(-2, 2), ylim=(-3, 3))
plt.show()
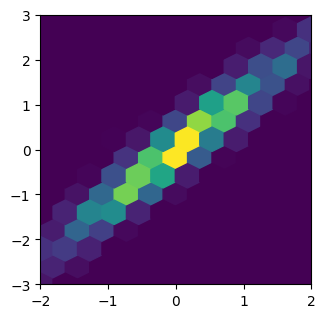
[8]:
#
# hexbin(x, y, C)
#
np.random.seed(1)
x = np.random.randn(5000)
y = 1.2 * x + np.random.randn(5000) / 3

fig, ax = plt.subplots(figsize=(3.5, 3.5))
ax.hexbin(x, y, gridsize=20)
ax.set(xlim=(-2, 2), ylim=(-3, 3))
plt.show()
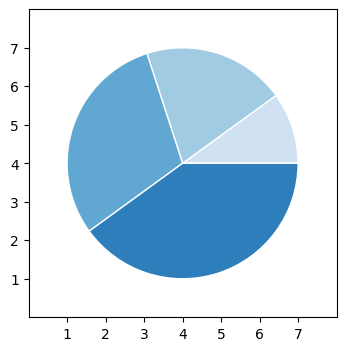
[9]:
#
# pie(x)
#
x = [1, 2, 3, 4]
colors = plt.get_cmap("Blues")(np.linspace(0.2, 0.7, len(x)))

fig, ax = plt.subplots(figsize=(4, 4.0))
ax.pie(
    x,
    colors=colors,
    radius=3,
    center=(4, 4),
    wedgeprops={"linewidth": 1, "edgecolor": "white"},
    frame=True,
)
ax.set(xlim=(0, 8), xticks=np.arange(1, 8), ylim=(0, 8), yticks=np.arange(1, 8))
plt.show()