Gráficos 3D#
Ultima modificación: Feb 04, 2024 | YouTube
[1]:
import matplotlib.pyplot as plt
import numpy as np
from matplotlib import cm
from mpl_toolkits.mplot3d import axes3d
[2]:
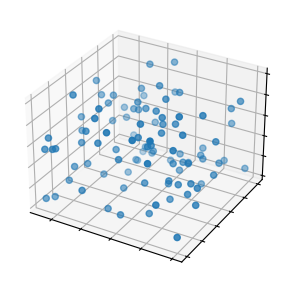
#
# 3D scatterplot
#
np.random.seed(19680801)
n = 100
rng = np.random.default_rng()
xs = rng.uniform(23, 32, n)
ys = rng.uniform(0, 100, n)
zs = rng.uniform(-50, -25, n)

fig, ax = plt.subplots(subplot_kw={"projection": "3d"}, figsize=(3.5, 3.5))
ax.scatter(xs, ys, zs)
ax.set(xticklabels=[], yticklabels=[], zticklabels=[])
plt.show()
[3]:
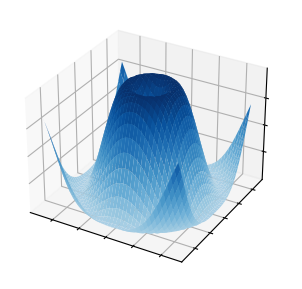
#
# 3D surface
#
X = np.arange(-5, 5, 0.25)
Y = np.arange(-5, 5, 0.25)
X, Y = np.meshgrid(X, Y)
R = np.sqrt(X**2 + Y**2)
Z = np.sin(R)

fig, ax = plt.subplots(subplot_kw={"projection": "3d"}, figsize=(3.5, 3.5))
ax.plot_surface(X, Y, Z, vmin=Z.min() * 2, cmap=cm.Blues)
ax.set(xticklabels=[], yticklabels=[], zticklabels=[])
plt.show()
[4]:
#
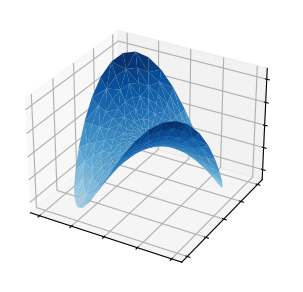
# Triangular 3D surface
#
n_radii = 8
n_angles = 36
radii = np.linspace(0.125, 1.0, n_radii)
angles = np.linspace(0, 2 * np.pi, n_angles, endpoint=False)[..., np.newaxis]
x = np.append(0, (radii * np.cos(angles)).flatten())
y = np.append(0, (radii * np.sin(angles)).flatten())
z = np.sin(-x * y)
fig, ax = plt.subplots(subplot_kw={"projection": "3d"}, figsize=(3.5, 3.5))
ax.plot_trisurf(x, y, z, vmin=z.min() * 2, cmap=cm.Blues)
ax.set(xticklabels=[], yticklabels=[], zticklabels=[])
plt.show()
[5]:
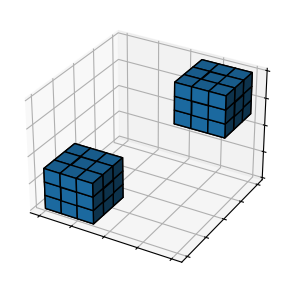
#
# 3D voxel / Volumetric plot
#
x, y, z = np.indices((8, 8, 8))
cube1 = (x < 3) & (y < 3) & (z < 3)
cube2 = (x >= 5) & (y >= 5) & (z >= 5)
voxelarray = cube1 | cube2

fig, ax = plt.subplots(subplot_kw={"projection": "3d"}, figsize=(3.5, 3.5))
ax.voxels(voxelarray, edgecolor="k")
ax.set(xticklabels=[], yticklabels=[], zticklabels=[])
plt.show()
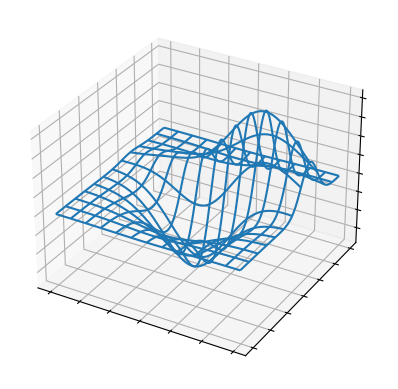
[6]:
#
# 3D wireframe plot
#
X, Y, Z = axes3d.get_test_data(0.05)

fig, ax = plt.subplots(subplot_kw={"projection": "3d"})
ax.plot_wireframe(X, Y, Z, rstride=10, cstride=10)
ax.set(xticklabels=[], yticklabels=[], zticklabels=[])
plt.show()