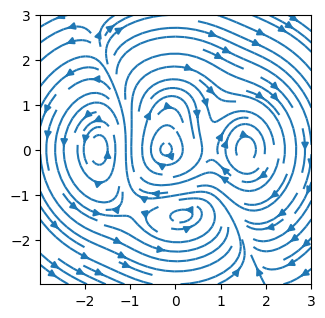
Gráficos de vectores y campos#
Ultima modificación: Feb 04, 2024 | YouTube
[1]:
import matplotlib.pyplot as plt
import numpy as np
[2]:
#
# imshow(Z)
#
x = [-3, -2, -1, 0, 1, 2, 3]
X, Y = np.meshgrid(x, x)
X
[2]:
array([[-3, -2, -1,  0,  1,  2,  3],
       [-3, -2, -1,  0,  1,  2,  3],
       [-3, -2, -1,  0,  1,  2,  3],
       [-3, -2, -1,  0,  1,  2,  3],
       [-3, -2, -1,  0,  1,  2,  3],
       [-3, -2, -1,  0,  1,  2,  3],
       [-3, -2, -1,  0,  1,  2,  3]])
[3]:
Y
[3]:
array([[-3, -3, -3, -3, -3, -3, -3],
       [-2, -2, -2, -2, -2, -2, -2],
       [-1, -1, -1, -1, -1, -1, -1],
       [ 0,  0,  0,  0,  0,  0,  0],
       [ 1,  1,  1,  1,  1,  1,  1],
       [ 2,  2,  2,  2,  2,  2,  2],
       [ 3,  3,  3,  3,  3,  3,  3]])
[4]:
Z = X**2 + Y**2
Z.round(3)
[4]:
array([[18, 13, 10,  9, 10, 13, 18],
       [13,  8,  5,  4,  5,  8, 13],
       [10,  5,  2,  1,  2,  5, 10],
       [ 9,  4,  1,  0,  1,  4,  9],
       [10,  5,  2,  1,  2,  5, 10],
       [13,  8,  5,  4,  5,  8, 13],
       [18, 13, 10,  9, 10, 13, 18]])
[5]:
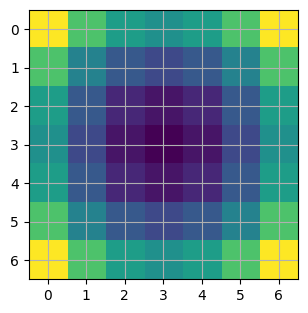
fig, ax = plt.subplots(figsize=(3.5, 3.5))
ax.imshow(Z)
ax.set(xticks=[0, 1, 2, 3, 4, 5, 6], yticks=[0, 1, 2, 3, 4, 5, 6])
plt.grid()
plt.show()
[6]:
#
# pcolormesh(X, Y, Z)
#
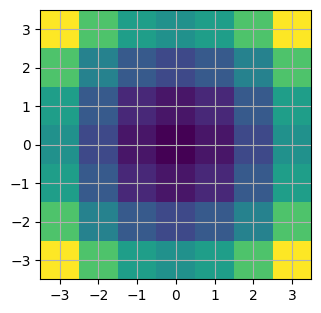
fig, ax = plt.subplots(figsize=(3.5, 3.5))
ax.pcolormesh(X, Y, Z)
ax.set(xticks=x, yticks=x)
plt.grid()
plt.show()
[7]:
#
# contour(X, Y, Z)
#
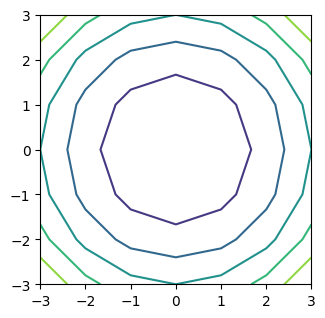
levels = np.linspace(np.min(Z), np.max(Z), 7)
fig, ax = plt.subplots(figsize=(3.5, 3.5))
ax.contour(X, Y, Z, levels=levels)
plt.show()
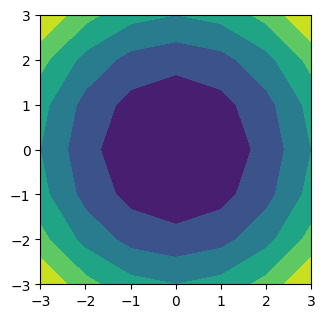
[8]:
#
# contourf(X, Y, Z)
#
levels = np.linspace(Z.min(), Z.max(), 7)
fig, ax = plt.subplots(figsize=(3.5, 3.5))
ax.contourf(X, Y, Z, levels=levels)
plt.show()
[9]:
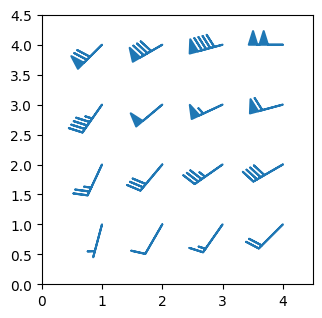
#
# barb(X, Y, U, V)
# Grafico de puas usado para visualizar la dirección y velocidad
# del viento.
X, Y = np.meshgrid([1, 2, 3, 4], [1, 2, 3, 4])
angle = (
    np.pi
    / 180
    * np.array(
        [
            [15.0, 30, 35, 45],
            [25.0, 40, 55, 60],
            [35.0, 50, 65, 75],
            [45.0, 60, 75, 90],
        ]
    )
)
amplitude = np.array(
    [
        [5, 10, 15, 20],
        [25, 30, 35, 40],
        [45, 50, 55, 60],
        [70, 80, 90, 100],
    ]
)
U = amplitude * np.sin(angle)
V = amplitude * np.cos(angle)

fig, ax = plt.subplots(figsize=(3.5, 3.5))
ax.barbs(X, Y, U, V, barbcolor="C0", flagcolor="C0", length=7, linewidth=1.5)
ax.set(xlim=(0, 4.5), ylim=(0, 4.5))
plt.show()
[10]:
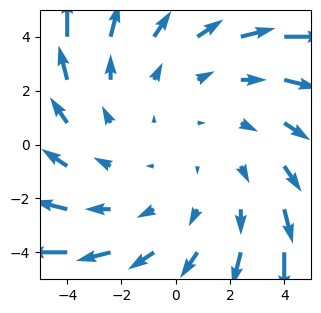
#
# quiver(X, Y, U, V)
#
x = np.linspace(-4, 4, 6)
y = np.linspace(-4, 4, 6)
X, Y = np.meshgrid(x, y)
U = X + Y
V = Y - X

fig, ax = plt.subplots(figsize=(3.5, 3.5))
ax.quiver(X, Y, U, V, color="C0", angles="xy", scale_units="xy", scale=5, width=0.015)
ax.set(xlim=(-5, 5), ylim=(-5, 5))
plt.show()
[11]:
#
# streamplot(X, Y, U, V)
#
X, Y = np.meshgrid(np.linspace(-3, 3, 256), np.linspace(-3, 3, 256))
Z = (1 - X / 2 + X**5 + Y**3) * np.exp(-(X**2) - Y**2)
V = np.diff(Z[1:, :], axis=1)
U = -np.diff(Z[:, 1:], axis=0)

fig, ax = plt.subplots(figsize=(3.5, 3.5))
ax.streamplot(X[1:, 1:], Y[1:, 1:], U, V)
plt.show()
