Regresión polinómica#
Muestra de datos#
[1]:
#
# Función a aproximar
# (Proceso geneador de datos)
#
import numpy as np


def f(x):
    return 2 * np.abs(np.sin(x * np.pi / 4 + 0.75)) / (1 + 0.1 * x)


#
# Datos reales.
# (No disponibles en la realidad)
#
x_real = np.linspace(0, 10, 100)
X_real = x_real[:, np.newaxis]
y_real = f(x_real)
[2]:
#
# Muestra de datos.
# (Información disponible en la realidad)
#
rng = np.random.default_rng(12345)

x_sample = x_real.copy()
rng.shuffle(x_sample)
x_sample = x_sample[:25]
x_sample = np.sort(x_sample)

y_sample = f(x_sample)
X_sample = x_sample[:, np.newaxis]
Conjuntos de entrenamiento y test#
[3]:
from sklearn.model_selection import train_test_split

X_train, X_test, y_train_true, y_test_true = train_test_split(
    X_sample,
    y_sample,
    test_size=5,
    random_state=12345,
    shuffle=True,
)
Especificación del modelo#
[4]:
#
# Define el modelo usando una tuberia
#
from sklearn.linear_model import LinearRegression
from sklearn.pipeline import make_pipeline
from sklearn.preprocessing import MinMaxScaler, PolynomialFeatures

pipeline = make_pipeline(
    PolynomialFeatures(include_bias=False),
    MinMaxScaler(),
    LinearRegression(),
)

print(pipeline)
Pipeline(steps=[('polynomialfeatures', PolynomialFeatures(include_bias=False)),
                ('minmaxscaler', MinMaxScaler()),
                ('linearregression', LinearRegression())])
[5]:
#
# Esquema de validación cruzada
#
from sklearn.model_selection import LeaveOneOut

leaveOneOut = LeaveOneOut()

leaveOneOut
[5]:
LeaveOneOut()
[6]:
from sklearn.model_selection import GridSearchCV

param_grid = [
    {
        "polynomialfeatures__degree": list(range(1, 24)),
    },
]

gridSearchCV = GridSearchCV(
    estimator=pipeline,
    param_grid=param_grid,
    cv=leaveOneOut,
    scoring="neg_mean_squared_error",
    refit=True,
)

print(gridSearchCV)
GridSearchCV(cv=LeaveOneOut(),
             estimator=Pipeline(steps=[('polynomialfeatures',
                                        PolynomialFeatures(include_bias=False)),
                                       ('minmaxscaler', MinMaxScaler()),
                                       ('linearregression',
                                        LinearRegression())]),
             param_grid=[{'polynomialfeatures__degree': [1, 2, 3, 4, 5, 6, 7, 8,
                                                         9, 10, 11, 12, 13, 14,
                                                         15, 16, 17, 18, 19, 20,
                                                         21, 22, 23]}],
             scoring='neg_mean_squared_error')
Búsqueda de hiperparámetros#
[7]:
gridSearchCV.fit(X_train, y_train_true)
[7]:
GridSearchCV(cv=LeaveOneOut(),
             estimator=Pipeline(steps=[('polynomialfeatures',
                                        PolynomialFeatures(include_bias=False)),
                                       ('minmaxscaler', MinMaxScaler()),
                                       ('linearregression',
                                        LinearRegression())]),
             param_grid=[{'polynomialfeatures__degree': [1, 2, 3, 4, 5, 6, 7, 8,
                                                         9, 10, 11, 12, 13, 14,
                                                         15, 16, 17, 18, 19, 20,
                                                         21, 22, 23]}],
             scoring='neg_mean_squared_error')
In a Jupyter environment, please rerun this cell to show the HTML representation or trust the notebook. On GitHub, the HTML representation is unable to render, please try loading this page with nbviewer.org.
GridSearchCV(cv=LeaveOneOut(),
             estimator=Pipeline(steps=[('polynomialfeatures',
                                        PolynomialFeatures(include_bias=False)),
                                       ('minmaxscaler', MinMaxScaler()),
                                       ('linearregression',
                                        LinearRegression())]),
             param_grid=[{'polynomialfeatures__degree': [1, 2, 3, 4, 5, 6, 7, 8,
                                                         9, 10, 11, 12, 13, 14,
                                                         15, 16, 17, 18, 19, 20,
                                                         21, 22, 23]}],
scoring='neg_mean_squared_error')Pipeline(steps=[('polynomialfeatures', PolynomialFeatures(include_bias=False)),
('minmaxscaler', MinMaxScaler()),
('linearregression', LinearRegression())])PolynomialFeatures(include_bias=False)
MinMaxScaler()
LinearRegression()
[8]:
gridSearchCV.best_params_
[8]:
{'polynomialfeatures__degree': 10}
Pronóstico#
[9]:
y_pred = gridSearchCV.predict(X_real)
Visualización de resultados#
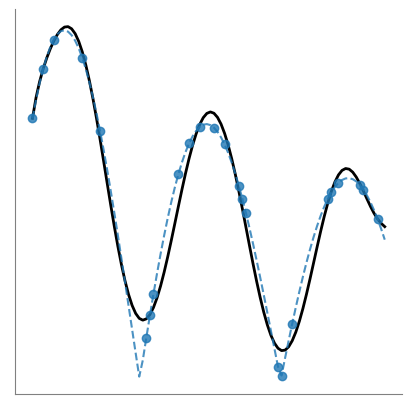
[10]:
import matplotlib.pyplot as plt

plt.figure(figsize=(5, 5))

plt.plot(x_real, y_real, "--", color="tab:blue", alpha=0.8, zorder=10)
plt.plot(x_sample, y_sample, "o", color="tab:blue", alpha=0.8, zorder=10)

plt.plot(
    x_real,
    y_pred,
    color="black",
    linewidth=2,
)

plt.xticks([], [])
plt.yticks([], [])

plt.gca().spines["left"].set_color("gray")
plt.gca().spines["bottom"].set_color("gray")
plt.gca().spines["top"].set_visible(False)
plt.gca().spines["right"].set_visible(False)

plt.show()
