La función make_circles — 3:33 min#
3:33 min | Ultima modificación: Septiembre 27, 2021 | YouTube
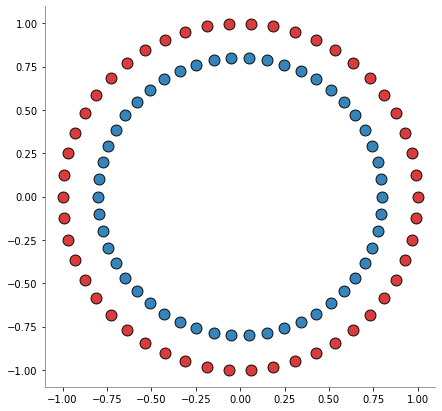
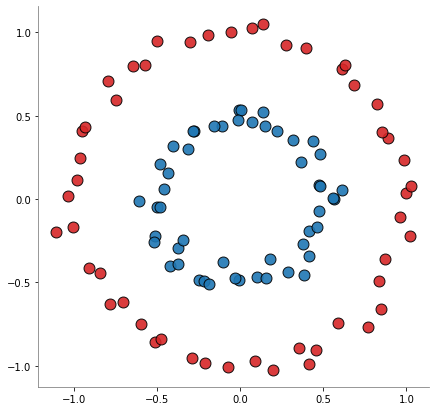
Esta función de scikit-learn, permite la creacion de círculos concentricos de datos donde cada círculo representa una clase. En este video se discuten los parámetros de la función.
[1]:
import matplotlib.pyplot as plt
from sklearn.datasets import make_circles

X, y = make_circles(
    # -------------------------------------------------------------------------
    # The number of samples.
    n_samples=100,
    # -------------------------------------------------------------------------
    # Shuffle the samples.
    shuffle=False,
    # -------------------------------------------------------------------------
    # Standard deviation of Gaussian noise added to the data.
    noise=0.0,
    # -------------------------------------------------------------------------
    # Determines random number generation for dataset shuffling and noise. Pass
    # an int for reproducible output across multiple function calls.
    # creation.
    random_state=12346,
    # -------------------------------------------------------------------------
    # Scale factor between inner and outer circle in the range (0, 1).
    factor=0.8,
)


plt.figure(figsize=(7, 7))
plt.scatter(
    X[y == 0, 0],
    X[y == 0, 1],
    color="tab:red",
    edgecolors="k",
    s=120,
    alpha=0.9,
)
plt.scatter(
    X[y == 1, 0],
    X[y == 1, 1],
    color="tab:blue",
    edgecolors="k",
    s=120,
    alpha=0.9,
)


plt.gca().spines["left"].set_color("gray")
plt.gca().spines["bottom"].set_color("gray")
plt.gca().spines["top"].set_visible(False)
plt.gca().spines["right"].set_visible(False)

[2]:
X, y = make_circles(
    n_samples=100,
    shuffle=False,
    noise=0.05,
    random_state=12346,
    factor=0.5,
)

plt.figure(figsize=(7, 7))
plt.scatter(
    X[y == 0, 0],
    X[y == 0, 1],
    color="tab:red",
    edgecolors="k",
    s=120,
    alpha=0.9,
)
plt.scatter(
    X[y == 1, 0],
    X[y == 1, 1],
    color="tab:blue",
    edgecolors="k",
    s=120,
    alpha=0.9,
)


plt.gca().spines["left"].set_color("gray")
plt.gca().spines["bottom"].set_color("gray")
plt.gca().spines["top"].set_visible(False)
plt.gca().spines["right"].set_visible(False)
plt.axis("equal")
plt.show()
