La función make_blobs — 7:11 min#
7:11 min | Ultima modificación: Septiembre 27, 2021 | YouTube
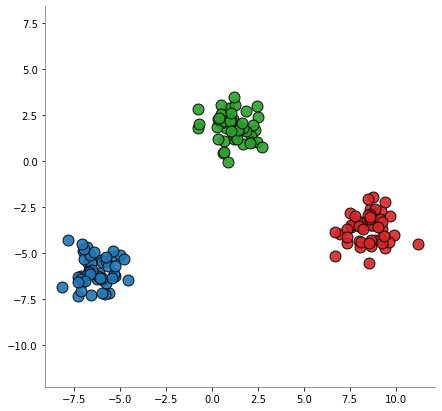
La función make_blobs de scikit-learn se usa para generar clusters de datos n-dimensionales, los cuales son usados para probar algoritmos de clustering y clasificación. En esta lección se describe el uso de esta función.
[1]:
import matplotlib.pyplot as plt
from sklearn.datasets import make_blobs

X, y = make_blobs(
    # -------------------------------------------------------------------------
    # If int, it is the total number of points equally divided among clusters.
    # If array-like, each element of the sequence indicates the number of
    # samples per cluster
    n_samples=150,
    # -------------------------------------------------------------------------
    # The number of features for each sample.
    n_features=2,
    # -------------------------------------------------------------------------
    # The number of centers to generate, or the fixed center locations.
    centers=3,
    # -------------------------------------------------------------------------
    # The standard deviation of the clusters.
    cluster_std=0.8,
    # -------------------------------------------------------------------------
    # The bounding box for each cluster center when centers are generated at
    # random.
    center_box=(-10, 10),
    # -------------------------------------------------------------------------
    # Shuffle the samples.
    shuffle=False,
    # -------------------------------------------------------------------------
    # Determines random number generation for dataset creation.
    random_state=12345,
)


plt.figure(figsize=(7, 7))

plt.scatter(
    X[:50, 0],
    X[:50, 1],
    color="tab:red",
    edgecolors="k",
    s=120,
    alpha=0.9,
)
plt.scatter(
    X[50:100, 0],
    X[50:100, 1],
    color="tab:blue",
    edgecolors="k",
    s=120,
    alpha=0.9,
)
plt.scatter(
    X[100:, 0],
    X[100:, 1],
    color="tab:green",
    edgecolors="k",
    s=120,
    alpha=0.9,
)

plt.gca().spines["left"].set_color("gray")
plt.gca().spines["bottom"].set_color("gray")
plt.gca().spines["top"].set_visible(False)
plt.gca().spines["right"].set_visible(False)
plt.axis("equal")
plt.show()

[5]:
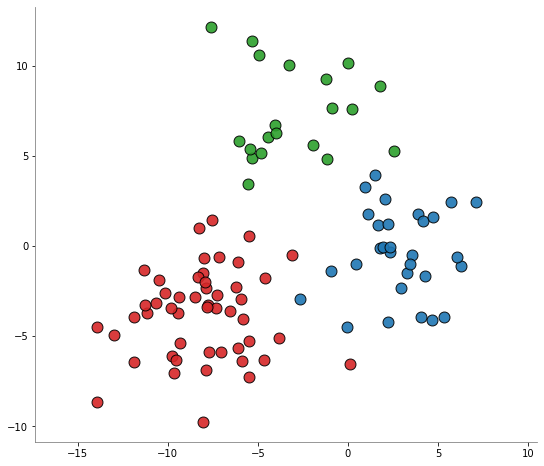
X, y = make_blobs(
    n_samples=[50, 30, 20],
    n_features=2,
    centers=[
        [-8, -4],
        [3, 0],
        [-3, 7],
    ],
    cluster_std=2.5,
    center_box=(-10, 10),
    shuffle=False,
    random_state=12345,
)


plt.figure(figsize=(9, 8))

plt.scatter(
    X[:50, 0],
    X[:50, 1],
    color="tab:red",
    edgecolors="k",
    s=120,
    alpha=0.9,
)
plt.scatter(
    X[50:80, 0],
    X[50:80, 1],
    color="tab:blue",
    edgecolors="k",
    s=120,
    alpha=0.9,
)
plt.scatter(
    X[80:, 0],
    X[80:, 1],
    color="tab:green",
    edgecolors="k",
    s=120,
    alpha=0.9,
)

plt.gca().spines["left"].set_color("gray")
plt.gca().spines["bottom"].set_color("gray")
plt.gca().spines["top"].set_visible(False)
plt.gca().spines["right"].set_visible(False)
plt.axis("equal")
plt.show()
