La función make_regression — 4:02 min#
4:02 min | Ultima modificación: Septiembre 27, 2021 | YouTube
Generación de problemas aleatorios de regresión.
[1]:
import matplotlib.pyplot as plt
from sklearn.datasets import make_regression

X, y = make_regression(
    # -------------------------------------------------------------------------
    # The number of samples.
    n_samples=100,
    # -------------------------------------------------------------------------
    # The total number of features.
    n_features=1,
    # -------------------------------------------------------------------------
    # The number of regression targets, i.e., the dimension of the y output
    # vector associated with a sample. By default, the output is a scalar.
    n_targets=1,
    # -------------------------------------------------------------------------
    # The bias term in the underlying linear model.
    bias=0.0,
    # -------------------------------------------------------------------------
    # if None:
    #   The input set is well conditioned, centered and gaussian with unit
    #   variance.
    # if not None:
    #   The approximate number of singular vectors required to explain most of
    #   the input data by linear combinations. Using this kind of singular
    #   spectrum in the input allows the generator to reproduce the correlations
    #   often observed in practice.
    effective_rank=None,
    # -------------------------------------------------------------------------
    # The relative importance of the fat noisy tail of the singular values
    # profile if effective_rank is not None. When a float, it should be between
    # 0 and 1.
    tail_strength=0.5,
    # -------------------------------------------------------------------------
    # The standard deviation of the gaussian noise applied to the output.
    noise=8.0,
    # -------------------------------------------------------------------------
    # If True, the coefficients of the underlying linear model are returned.
    coef=False,
    # -------------------------------------------------------------------------
    # Shuffle the samples.
    shuffle=False,
    # -------------------------------------------------------------------------
    # Determines random number generation for dataset
    # creation.
    random_state=12345,
)


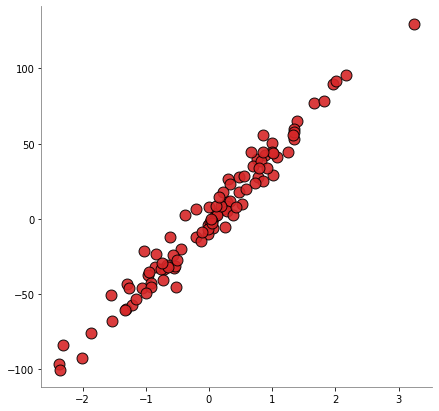
plt.figure(figsize=(7, 7))
plt.scatter(
    X[:, 0],
    y,
    color="tab:red",
    edgecolors="k",
    s=120,
    alpha=0.9,
)


plt.gca().spines["left"].set_color("gray")
plt.gca().spines["bottom"].set_color("gray")
plt.gca().spines["top"].set_visible(False)
plt.gca().spines["right"].set_visible(False)
plt.show()
