sklearn.tree.plot_tree#
Ultima modificación: 2023-03-11 | YouTube
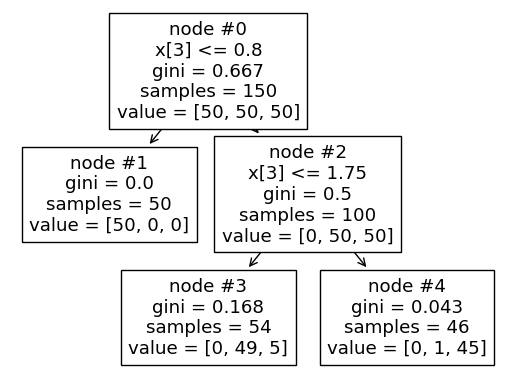
Permite graficar un arbol de decisión.
La visualización es ajustada automaticamente al tamaño del eje.
Use los argumentos
figsizeodpideplt.figurepara controlar el tamaño de la figura.
[1]:
from sklearn.datasets import load_iris

iris = load_iris()
X = iris['data']
y = iris['target']
[2]:
from sklearn.tree import DecisionTreeClassifier

decisionTreeClassifier = DecisionTreeClassifier(random_state=0, max_depth=2)
decisionTreeClassifier.fit(X, y)
[2]:
DecisionTreeClassifier(max_depth=2, random_state=0)In a Jupyter environment, please rerun this cell to show the HTML representation or trust the notebook.
On GitHub, the HTML representation is unable to render, please try loading this page with nbviewer.org.
DecisionTreeClassifier(max_depth=2, random_state=0)
[3]:
from sklearn.tree import plot_tree

plot_tree(
    # --------------------------------------------------------------------------
    # The decision tree to be plotted.
    decision_tree=decisionTreeClassifier,
    # --------------------------------------------------------------------------
    # The maximum depth of the representation. If None, the tree is fully
    # generated.
    max_depth=10,
    # --------------------------------------------------------------------------
    # Names of each of the features. If None, generic names will be used
    # (“x[0]”, “x[1]”, …).
    feature_names=None,
    # --------------------------------------------------------------------------
    # Names of each of the target classes in ascending numerical order. Only
    # relevant for classification and not supported for multi-output. If True,
    # shows a symbolic representation of the class name.
    class_names=None,
    # --------------------------------------------------------------------------
    # Whether to show informative labels for impurity, etc.
    # * ‘all’ to show at every node,
    # * ‘root’ to show only at the top root node,
    # * ‘none’ to not show at any node.
    label='all',
    # --------------------------------------------------------------------------
    # When set to True, paint nodes to indicate majority class for
    # classification, extremity of values for regression, or purity of node for
    # multi-output.
    filled=False,
    # --------------------------------------------------------------------------
    # When set to True, show the impurity at each node.
    impurity=True,
    # --------------------------------------------------------------------------
    # When set to True, show the ID number on each node.
    node_ids=True,
    # --------------------------------------------------------------------------
    # When set to True, change the display of ‘values’ and/or ‘samples’ to be
    # proportions and percentages respectively.
    proportion=False,
    # --------------------------------------------------------------------------
    # When set to True, draw node boxes with rounded corners and use Helvetica
    # fonts instead of Times-Roman.
    rounded=False,
    # --------------------------------------------------------------------------
    # Number of digits of precision for floating point in the values of
    # impurity, threshold and value attributes of each node.
    precision=3,
    # --------------------------------------------------------------------------
    # Matplotlib axes to plot to. If None, use current axis. Any previous
    # content is cleared.
    ax=None,
    # --------------------------------------------------------------------------
    # Size of text font. If None, determined automatically to fit figure.
    fontsize=None,
);
